📊Reading Notes for "LEMMA-RCA"
Overview
This paper introduces a new large dataset named LEMMA-RCA for diverse RCA tasks across multiple domains and modalities. This dataset contains IT and OT operation systems from the real world. They also evaluate eight baseline methods on this dataset to prove the high quality of LEMMA_RCA. The official website is https://lemma-rca.github.io/.
-
What problem does the paper try to solve?
The use of automated methods for root cause analysis is crucial, but currently, there is a lack of a mainstream dataset and fair comparison is not possible.
-
What is the proposed solution?
They proposed a rich dataset LEMMA-RCA containing multiple sub-datasets.
-
What are the key experimental results in this paper?
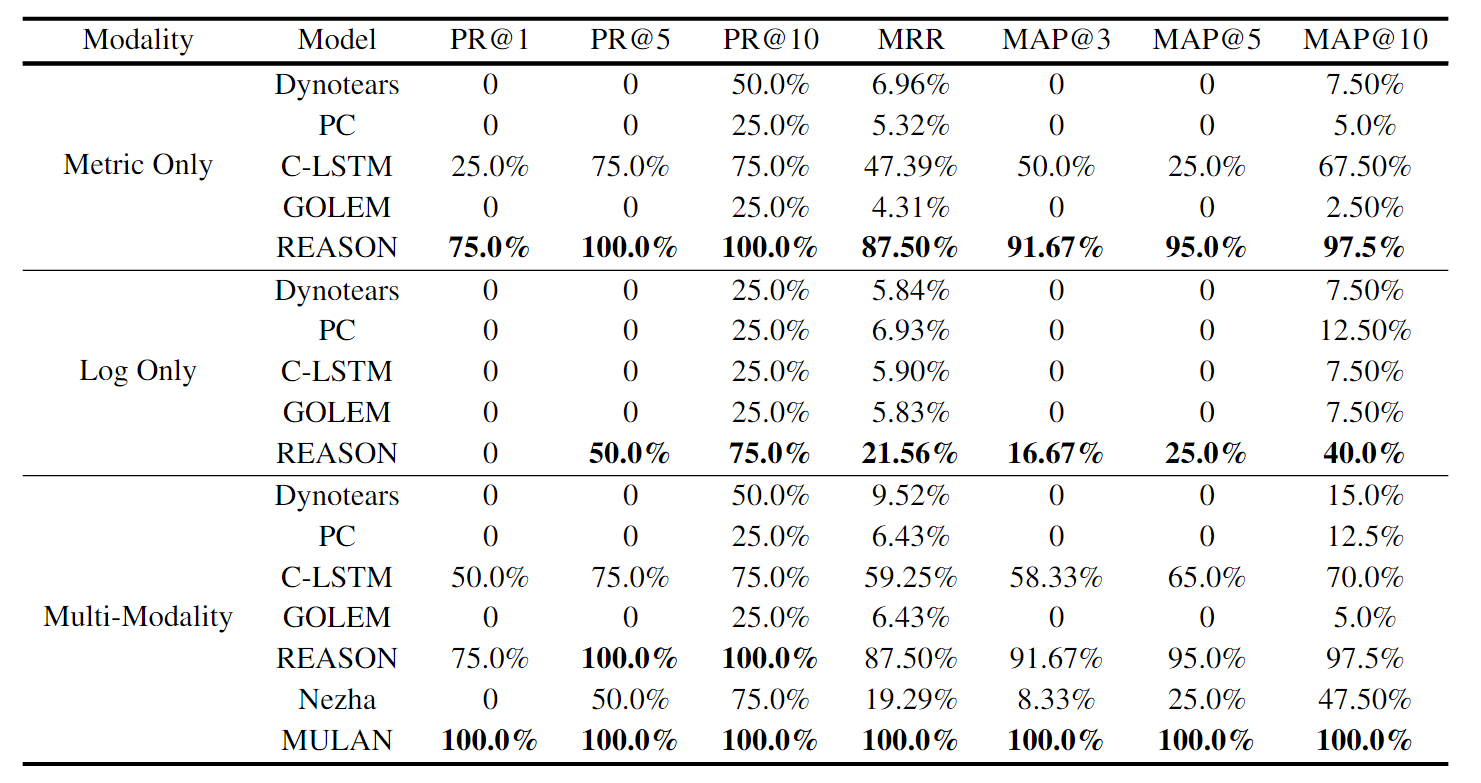
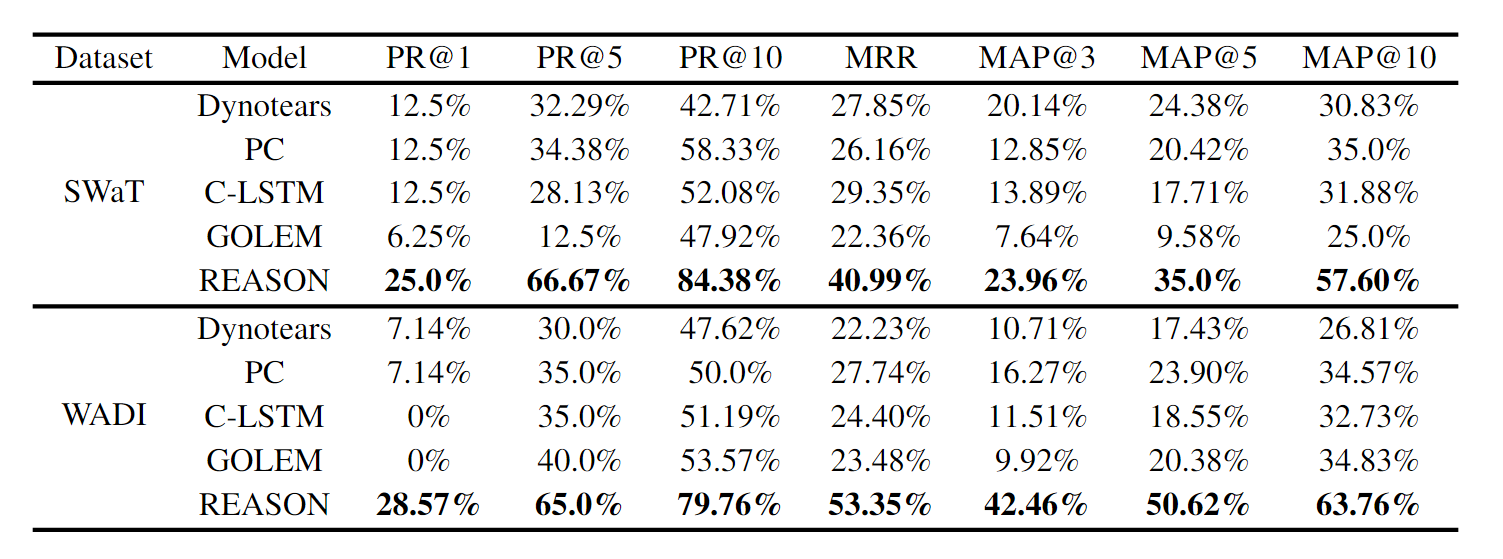
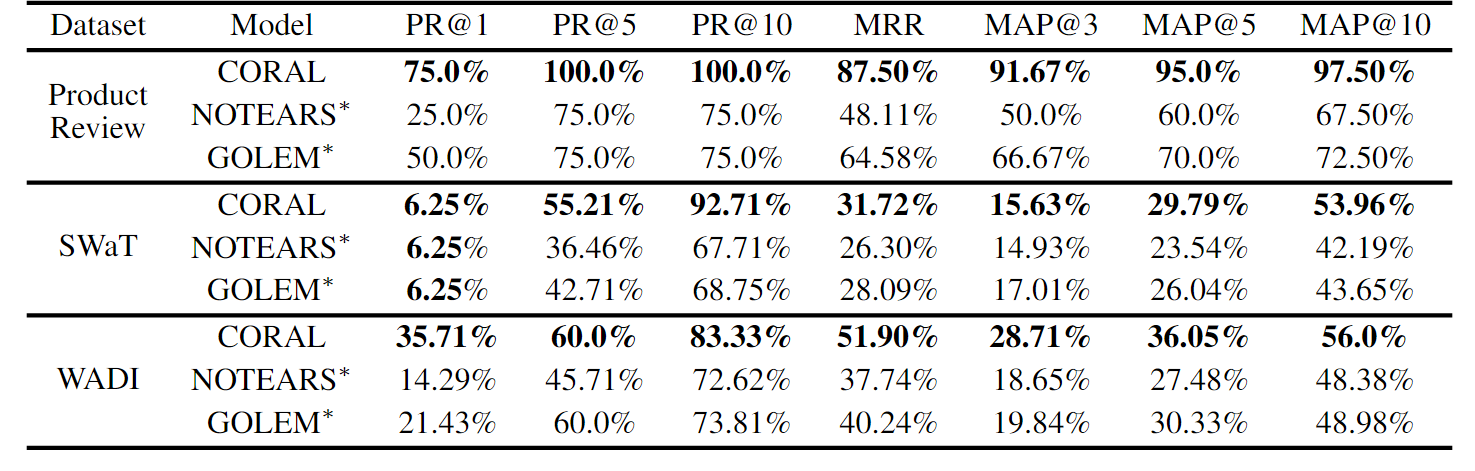
Tested the performance of 8 models on the LEMMA-RCA dataset.
-
What are the main contributions of the paper?
They propose the LEMMA-RCA dataset and evaluate eight baseline models on this.
-
What are the strong points and weak points in this paper?
- Strong Point: Proposed a new dataset and conducted extensive evaluation.
- Weak Point: There are no baseline methods not belonging to the causal-graph-based model.
Background
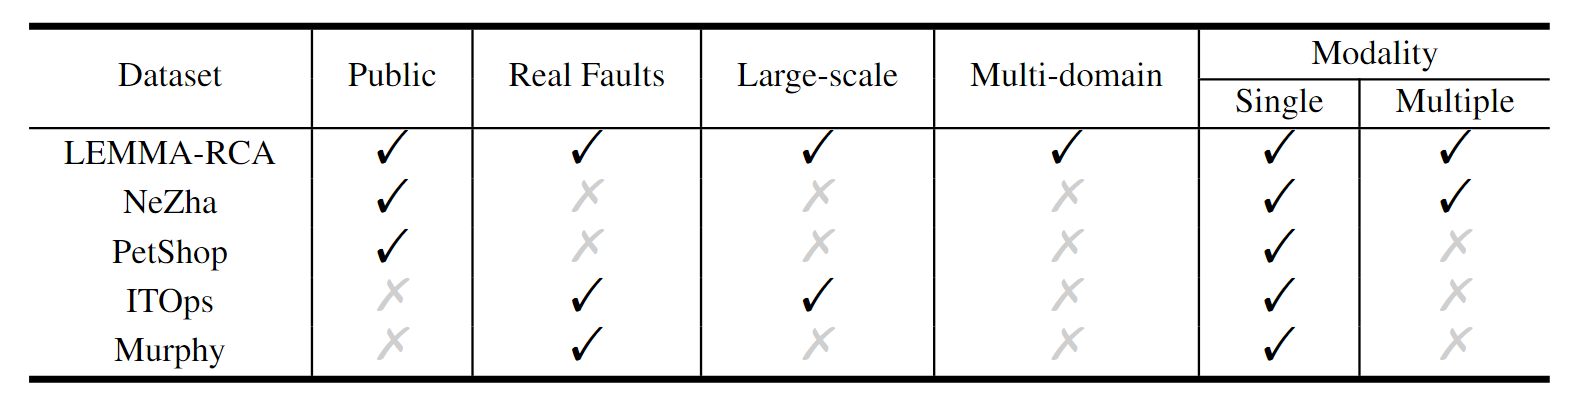
Root cause analysis (RCA) is essential for identifying the underlying causes of system failures and ensuring the reliability and robustness of real-world systems. However, traditional manual RCA is labor-intensive, costly, and prone to errors, so data-driven methods are needed. Despite significant progress in RCA techniques, the large-scale public datasets remain limited.
In RCA fields, here are some important keywords:
- Key Performance Indicator (KPI) is a time series indicating the system status, such as latency and service response time in microservice systems.
- Entity Metrics are multivariate time series collected by monitoring numerous system entities or components, such as CPU/Memory utilization in microservice systems.
- Data-driven Root Cause Analysis Problem. Given the monitoring data of system entities and system KPIs, identify the top K system entities that are relevant to KPIs when the system fails.
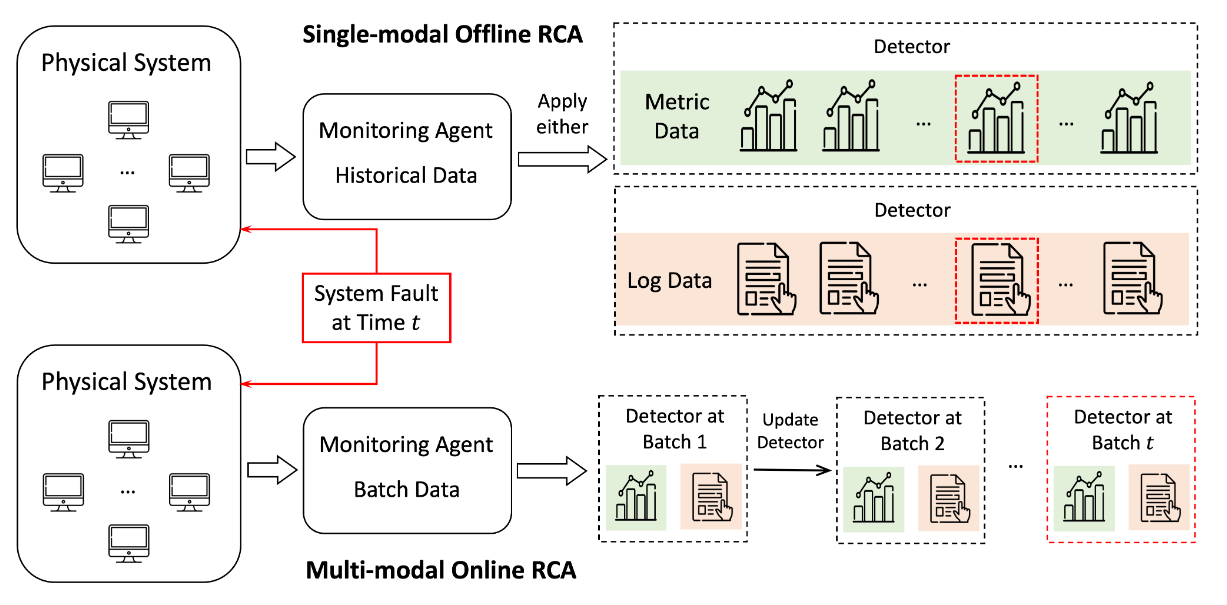
- Offline/Online: Offline RCA only uses historical data to determine past failures; Online RCA operates in real-time using current data streams to promptly address issues.
- Single-modal/multi-modal: Single-modal RCA relies solely on one type of data for a focused analysis; Multi-modal RCA uses multiple data sources for a comprehensive assessment.
Dataset
Base Information
LEMMA-RCA is a multi-domain, multi-modal dataset that includes textual system logs with millions of event records and time series metric data collected from real system faults. This dataset includes IT and OT scenes, such as microservice and water treatment.
Collection
The dataset collected from two domains, divided into four sub-datasets:
-
IT operations
-
Product Review
Platform: Composed of six OpenShift nodes and 216 system pods.
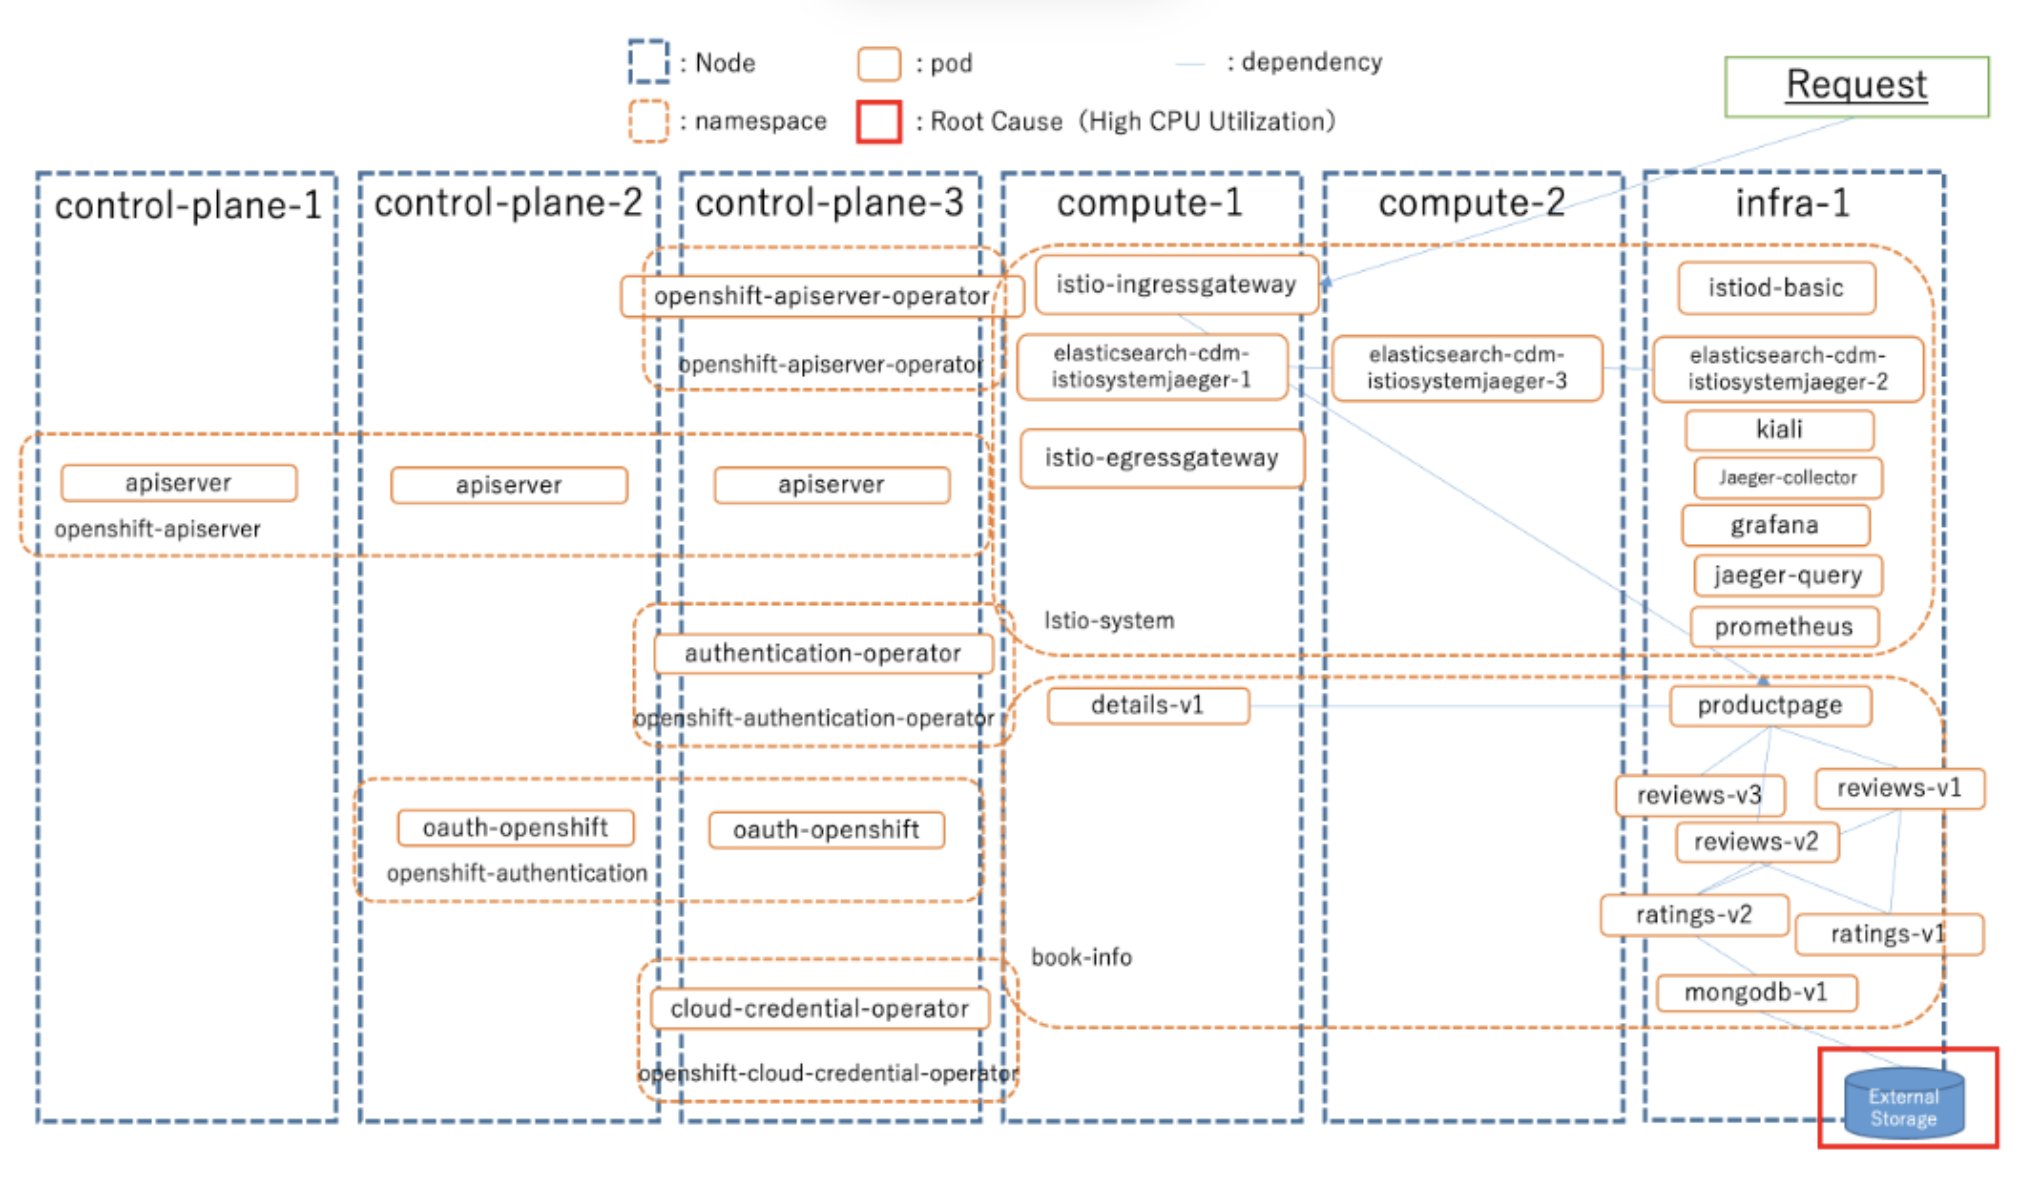
The architecture of Product Review Platform Faults: out-of-memory, high-CPU-usage, external-storage-full, DDos attack.
Metrics: Using Prometheus to record eleven types of node-level metrics and six types of pod-level metrics; Using ElasticSearch to collect log data including timestamp, pod name, log message, etc; Using JMeter to collect the system status information.
KPI: Consider latency as system KPI due to system failure will result in latency significantly increasing.
-
Cloud Computing
Platform: Eleven system nodes.
Faults: six different types of faults, such as cryptojacking, configuration change failure, etc.
Metrics: Extracting system metrics from CloudWatch Metrics on EC2 instances; Extracting three logs types (log messages, API debug log, and MySQL log) from CloudWatch Logs; Using JMeter tools to record error rate and utilization rate as KPIs.
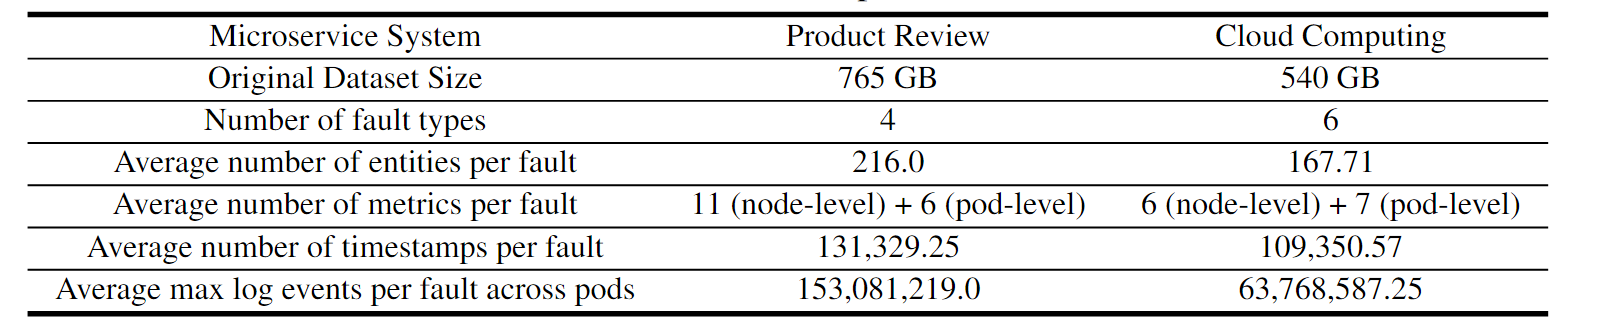
Data statistics of IT operation sub-datasets. -
-
OT operations
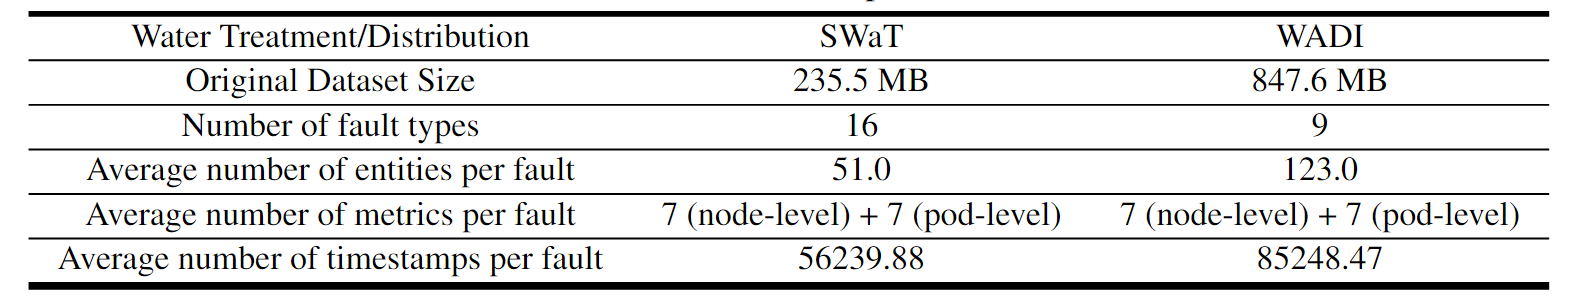
- SWaT: Collected over an 11-day period from a water treatment testbed equipped with 51 sensors. The system operated normally during the first 7 days, followed by attacks over the last 4 days, resulting in 16 system faults.
- WADI: Gathered from a water distribution testbed over 16 days, featuring 123 sensors and actuators. The system maintained normal operations for the first 14 days before experiencing attacks in the final 2 days, with 15 system faults recorded.
Preprocessing
Some non-stationary data are unpredictable and cannot be effectively modeled, which means they should be excluded. Thus this paper introduces some methods to preprocessing the data.
Log Feature Extraction. Due to the log data being unstructured and some of them being unmeaning, this paper transforms the log data into the time-series format. First, they use log-parsing tools to structure the log message. Then they segment the data using 10-minute windows with 30-second intervals and calculate the occurrence frequency as the first feature type donated as . Then, they introduce a second feature type based on “Golden signals” derived from domain knowledge, such as the frequency of abnormal logs associated with system failures like DDoS attacks, storage failures, and resource over-utilization. This feature is donated as . Finally, they segment the log using the same time windows and apply PCA to reduce feature dimensionality, selecting the most significant component as . The overall data can form as matrix .
KPI Construction. Using anomaly detection algorithms to model the SWaT and WADI datasets, and transform the discrete value into continuous format.
Experiments
Metrics
Precision@K (PR@K): It measures the probability that the top predicted root causes are real, formulated as:
Where is the set of system faults, is one fault, is the real root cause of , is the predicted root cause of , and is the -th predicted cause of .
Mean Average Precision@K (MAP@K): It assesses the top predicted causes from the overall perspective, formulated as:
Mean Reciprocal Rank (MRR): It evaluates the ranking capability of models, formulated as:
Where is the rank number of the first correctly predicted root cause for system fault .
Baselines
Causal-graph-based RCA methods can provide deeper insights into system failures, thus all baseline methods fall into this category.
- PC: Classic constrain-based causal discovery algorithm that can identify the causal graph’s skeleton using an independence test.
- Dynotears: It construct dynamic Bayesian networks through vector autoregression models.
- C-LSTM: Utilizes LSTM to model temporal dependencies and capture nonlinear Granger causality.
- GOLEM: relaxing the hard Directed Acyclic Graph (DAG) constraint of NOTEARS with a scoring function
- REASON: An interdependent network model learning both intra-level and inter-level causal relationships.
- Nezha: A multi-modal method designed to identify root causes by detecting abnormal patterns.
- MULAN: A multi-modal RCA method that learns the correlation between different modalities and co-constructs a causal graph for root cause identification
- CORAL: An online single-modal RCA method based on incremental disentangled causal graph learning.
Results